Air Quality - Wildfire Smoke Basic
Monitoring wildfire smoke in the U.S.A.
Multiple U.S. government agencies have set up web-based monitoring tools for wildfire smoke so that users can determine the impact to their location.
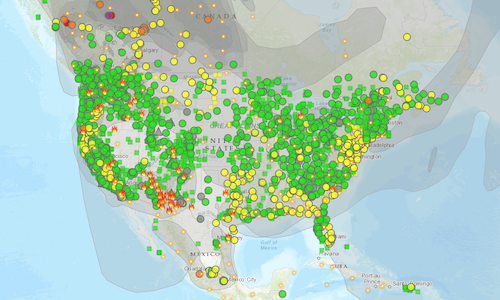
Figure 1. AirNow Fire and Smoke Map
The AirNow Fire and Smoke Map (https://fire.airnow.gov/) is a collaborative effort between the U.S. Environmental Protection Agency (EPA) and the U.S. Forest Service (USFS). The map shows the following:
- The locations of fires based on either fire reports from the U.S. National Interagency Fire Center or from satellite-detected fires
- The extent of smoke plumes
- Air quality based on particulate matter (PM2.5) pollution detected at individual sensors
Users can click on a sensor icon in their area of interest to get more detailed information on the Air Quality Index (AQI) and PM2.5 concentrations for the current time as well as for recent history.
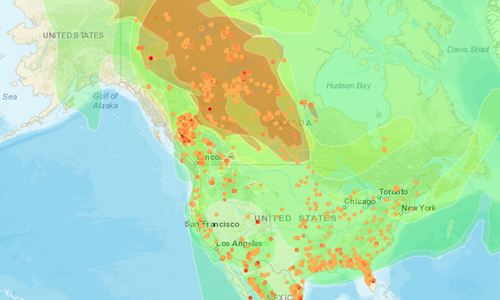
Figure 2. NOAA’s Hazard Mapping System
NOAA’s Hazard Mapping System (HMS) (https://www.ospo.noaa.gov/Products/land/hms.html#maps) also shows the locations of fires and the extent of smoke plumes. The smoke analysis is based on visual classification of plumes using GOES satellites ABI true-color imagery available during the sunlit part of the day. Both the fire points and smoke extent polygons can be downloaded as KML or SHP files for the current or historical analyses. In addition to the map products, a text product is produced twice a day with narrative descriptions of significant smoke and blowing dust.
Guide prepared by K. Pitts (7/2023). For corrections or expansions please contact us.