Anthropogenic Sources - Power Plants Basic

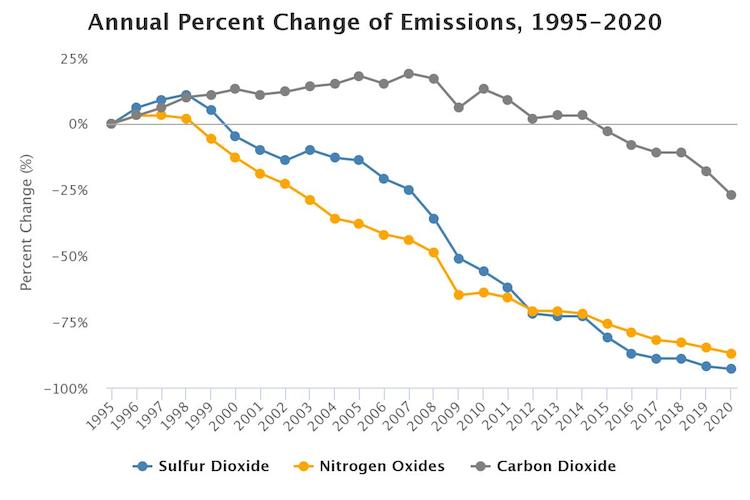
(Chart showing the U.S. power plant emission trends, from the U.S. EPA)
Reading Guide
Activities
(From the American Lung Association)
Power plant emissions originate from 1) burning fuel; 2) producing the fuel; and 3) transporting the fuels. The most significant health impacts from producing electricity come from the air emissions from burning fossil fuels, in particular, though not exclusively, from coal-burning power plants. Natural gas, oil, and biomass power plants also emit significant air pollutants. These emissions include sulfur dioxide, nitrogen dioxide, and carbon monoxide, as well as hazardous pollutants.
Mercury et al.
(From the U.S. EPA)
Power plants are currently the dominant emitters of mercury (50 percent), acid gases (over 75 percent), and many toxic metals (20-60 percent) in the United States.
U.S. Generation
(From the U.S. Energy Information Administration)
In the United States, about 65% of total electricity generation in 2018 was produced from fossil fuels (coal, natural gas, and petroleum), materials that come from plants (biomass), and municipal and industrial wastes. The substances that occur in combustion gases when these fuels are burned include:
- Carbon dioxide (CO2)
- Carbon monoxide (CO)
- Sulfur dioxide (SO2)
- Nitrogen oxides (NOx)
- Particulate matter (PM)
- Heavy metals such as mercury
U.S. Trends
(From the U.S. EPA)
In the US, the 2020 annual data show a 19 percent decline in SO2 emissions compared to 2019, a 16 percent decline in NOX emissions, an 11 percent decline in CO2 emissions, and a 17 percent decrease in Hg emissions. Additionally, ozone season NOX emissions dropped by 12% nationwide and 10% in the CSAPR Update states in 2020 compared to 2019. During this time period, electric generation from these power plants decreased by 6 percent.
From 1995-2020, annual emissions of SO2 from power plants fell by 93 percent and annual emissions of NOX from power plants fell by 87 percent. In 2020, sources in both the CSAPR SO2 annual program and the ARP together emitted 0.79 million tons, a reduction of 11 million tons, or 93 percent, from 1995 levels. In 2020, sources in both the Cross-State Air Pollution Rule (CSAPR) NOX annual program and the ARP together emitted 0.74 million tons, a reduction of 5.1 million tons, or 87 percent, from 1995 levels.
China and India
(From Carbon Brief)
Since 2000, the world has doubled its coal-fired power capacity to around 2,045 gigawatts (GW) after explosive growth in China and India. A further 200GW is being built and 300GW is planned.
Guide prepared by P. Zannetti (5/2021). For corrections or expansions please contact us.